
Every buyer I meet in the South Bay eventually asks the same question: what does it actually take to buy a home here right now? Last week, two new reports gave us the clearest answer in months. On October 30, the California Association of Realtors (C.A.R.) released its third quarter 2026 Housing Affordability Index, which puts the minimum income needed to buy a median priced single family home in Santa Clara County at $489,200 a year. A day earlier, the National Association of Realtors confirmed that the San Jose metro remains the most expensive housing market in the United States.
Those numbers can sound discouraging, but Santa Clara County affordability actually ticked up last quarter, mortgage rates have eased two weeks in a row, and there are real paths into ownership below the median. Below, I break down the new data, run the payment math at today’s rates, and explain what it means for buyers and sellers in San Jose and across Silicon Valley.
The key numbers at a glance
Here are the most important figures released in the past week, with the period each one covers:
- Santa Clara County affordability, Q3 2026: 23% of households could afford the median priced single family home, up from 22% in the second quarter (C.A.R.).
- Santa Clara County median price used in the index: $1,920,000, with a monthly payment of $12,230 including principal, interest, taxes and insurance (C.A.R.).
- Minimum qualifying income, Santa Clara County: $489,200 (C.A.R.).
- California statewide: 19% affordability, $894,630 median, $5,700 monthly payment and $228,000 minimum income, with an effective composite rate of 6.80% (C.A.R.).
- San Jose metro median, Q3 2026: $1,920,000, up 0.3% year over year and the highest of any U.S. metro (NAR).
- 30 year fixed mortgage rate: 7.24% for the week ending October 29, down from 7.32% the week before, versus 6.17% a year ago (Freddie Mac).
- San Jose metro new listings: up 17.9% year over year in the four weeks ending October 25, the largest increase of the major metros Redfin tracks (Redfin).
What the new C.A.R. affordability report found
C.A.R.’s Housing Affordability Index measures the share of households that earn enough to buy a median priced existing single family home, based on principal, interest, property taxes and insurance. It combines prices, rates and incomes into one useful reality check.
Statewide, the headline was stability. C.A.R. reported that 19% of California households could afford the median priced home in the third quarter, unchanged from the second quarter and from a year earlier. The statewide median slipped 2.3% from the second quarter to $894,630, which offset a higher effective mortgage rate of 6.80%, up from 6.54% in the second quarter. As C.A.R. put it, affordability “remained challenging as mortgage rates climbed and home prices stayed elevated.”
Across the Bay Area, C.A.R. put regional affordability at 24%, with a $1,300,000 median, an $8,280 monthly payment and a $331,200 minimum qualifying income. The county by county figures show a wide spread:
- San Mateo: 19% affordability, $2,270,000 median, $578,400 income needed, the highest income requirement in the state
- San Francisco: 19%, $2,000,000 median, $509,600 income needed
- Santa Clara: 23%, $1,920,000 median, $489,200 income needed
- Marin: 24%, $1,700,000 median, $433,200 income needed
- Alameda: 23%, $1,274,500 median, $324,800 income needed
- Contra Costa: 29%, $875,000 median, $222,800 income needed
- Solano: 33%, $590,000 median, $150,400 income needed
The detail I want you to notice: Santa Clara County’s affordability improved from 22% to 23%, and San Mateo’s from 18% to 19%. The change is small, but the direction matters. Slightly softer prices in parts of the South Bay are letting a few more households back into the market even with rates higher than they were in the spring.
Why San Jose is still the most expensive metro in America
NAR’s third quarter metro report, released October 29, placed the San Jose Sunnyvale Santa Clara metro at a $1.92 million median, up 0.3% from a year earlier, at the top of the national list for another quarter. The San Francisco Oakland Hayward metro ranked third at $1,350,900, up 2.7%. Nationally, the median single family price was $432,900, up 1.7%, and prices rose in 78% of the metro areas NAR tracks.
NAR chief economist Lawrence Yun explained the Bay Area’s resilience in one line: “The artificial intelligence technology boom continues to push Bay Area home prices higher.” Strong tech compensation, stock based wealth and a limited supply of single family homes near major employers continue to support prices, even with mortgage rates above 7%.
The payment math at today’s mortgage rates
Freddie Mac’s latest weekly survey put the 30 year fixed rate at 7.24% for the week ending October 29, the lowest level of the month, and the 15 year fixed at 6.60%. Chief economist Sam Khater noted that the average 30 year rate “declined again this week, reaching its lowest level this month.”
Here is what that means in dollars. The figures below are my own calculations of monthly principal and interest only on a 30 year fixed loan, before property taxes, insurance and any HOA dues:
- $1,920,000 home (county median), 20% down: $1,536,000 loan, about $10,468 a month at 7.24%, versus about $9,378 at last year’s 6.17%
- $1,500,000 home, 20% down: $1,200,000 loan, about $8,178 a month at 7.24%
- $1,000,000 home, 20% down: $800,000 loan, about $5,452 a month at 7.24%
- $800,000 condo or townhome, 20% down: $640,000 loan, about $4,362 a month at 7.24%
On a county median home, today’s rate costs roughly $1,090 more per month in principal and interest than last fall’s rate. That is the single biggest reason affordability has stayed tight even though Santa Clara County’s median price is lower than a year ago. Remember to add property taxes, which in California start at 1% of the purchase price under Proposition 13 plus local assessments, along with homeowners insurance.
Owning versus renting: the gap is widest here
California’s nonpartisan Legislative Analyst’s Office (LAO) published its own third quarter affordability tracker on October 21, and it adds important context. Statewide, the LAO estimates that owning a typical two bedroom home costs about $4,600 a month versus about $2,700 to rent, roughly 66% more. In Santa Clara County, it estimates the monthly cost of owning a two bedroom home at about 3.1 times the monthly rent. The LAO also found that the Bay Area and Los Angeles saw the largest growth in the own versus rent cost gap since 2020, and that about 75% of California homeowners have mortgage rates under 5%.
Owners with low rates have little reason to move, which keeps resale supply limited and prices firm, while renters face a steep jump in monthly costs when they buy. In Silicon Valley, ownership is a long term wealth decision more than a monthly savings decision. My Rent vs. Buy in San Jose breakdown walks through how to compare the two for your own situation.
What this means for buyers
1. Know your real number before you shop
The $489,200 income figure is a benchmark for the county median single family home, not a requirement for every purchase. Your actual budget depends on your down payment, debts, credit, loan type and the specific home. Ask your lender to run a fresh preapproval at today’s rate, especially if your last one was written when rates were higher.
2. Look below the median
Statewide, C.A.R. reported that 31% of households could afford the median priced condo or townhome at $640,000, compared with 19% for single family homes, and the statewide condo median fell 4.5% from the second quarter. In San Jose, condos and townhomes in neighborhoods such as North San Jose, Evergreen and Berryessa can be a realistic first step into ownership. Be sure to budget for HOA dues and review the association’s finances carefully; my guide on HOA rules and fees for San Jose condo buyers covers what to check.
3. Use the extra choice
Redfin’s latest weekly data showed San Jose metro new listings up 17.9% year over year in the four weeks ending October 25, the largest increase of the major metros it tracks, while the metro’s median sale price was down 4.9% over that period. More listings means more room to compare, ask questions and negotiate on terms such as repair credits or a seller paid rate buydown.
4. Plan for rate changes
Rates have moved every week this fall. Ask your lender about lock timing and float down options, and set a payment ceiling rather than a price ceiling. First time buyers can find more on programs and planning in my First-Time Homebuyer’s Guide to San Jose.
What this means for sellers
1. Your buyer pool is defined by the payment
When roughly three in four Santa Clara County households cannot afford the median single family home, every buyer who can is doing careful math. Pricing in line with recent neighborhood sales keeps your home inside more buyers’ payment range and protects you from sitting on the market while competing listings grow.
2. Incentives can beat price cuts
With the 30 year rate above 7%, a credit toward a rate buydown or closing costs can lower a buyer’s monthly payment more than an equal reduction in price. We can model both options side by side against your net proceeds before you decide.
3. The holiday season favors prepared sellers
Fewer homes typically list between Thanksgiving and the new year, and the buyers still shopping are usually serious. A move in ready home with disclosures ready on day one stands out. If you would rather wait, use the holidays to prepare for an early 2027 launch.
City and neighborhood notes for the South Bay
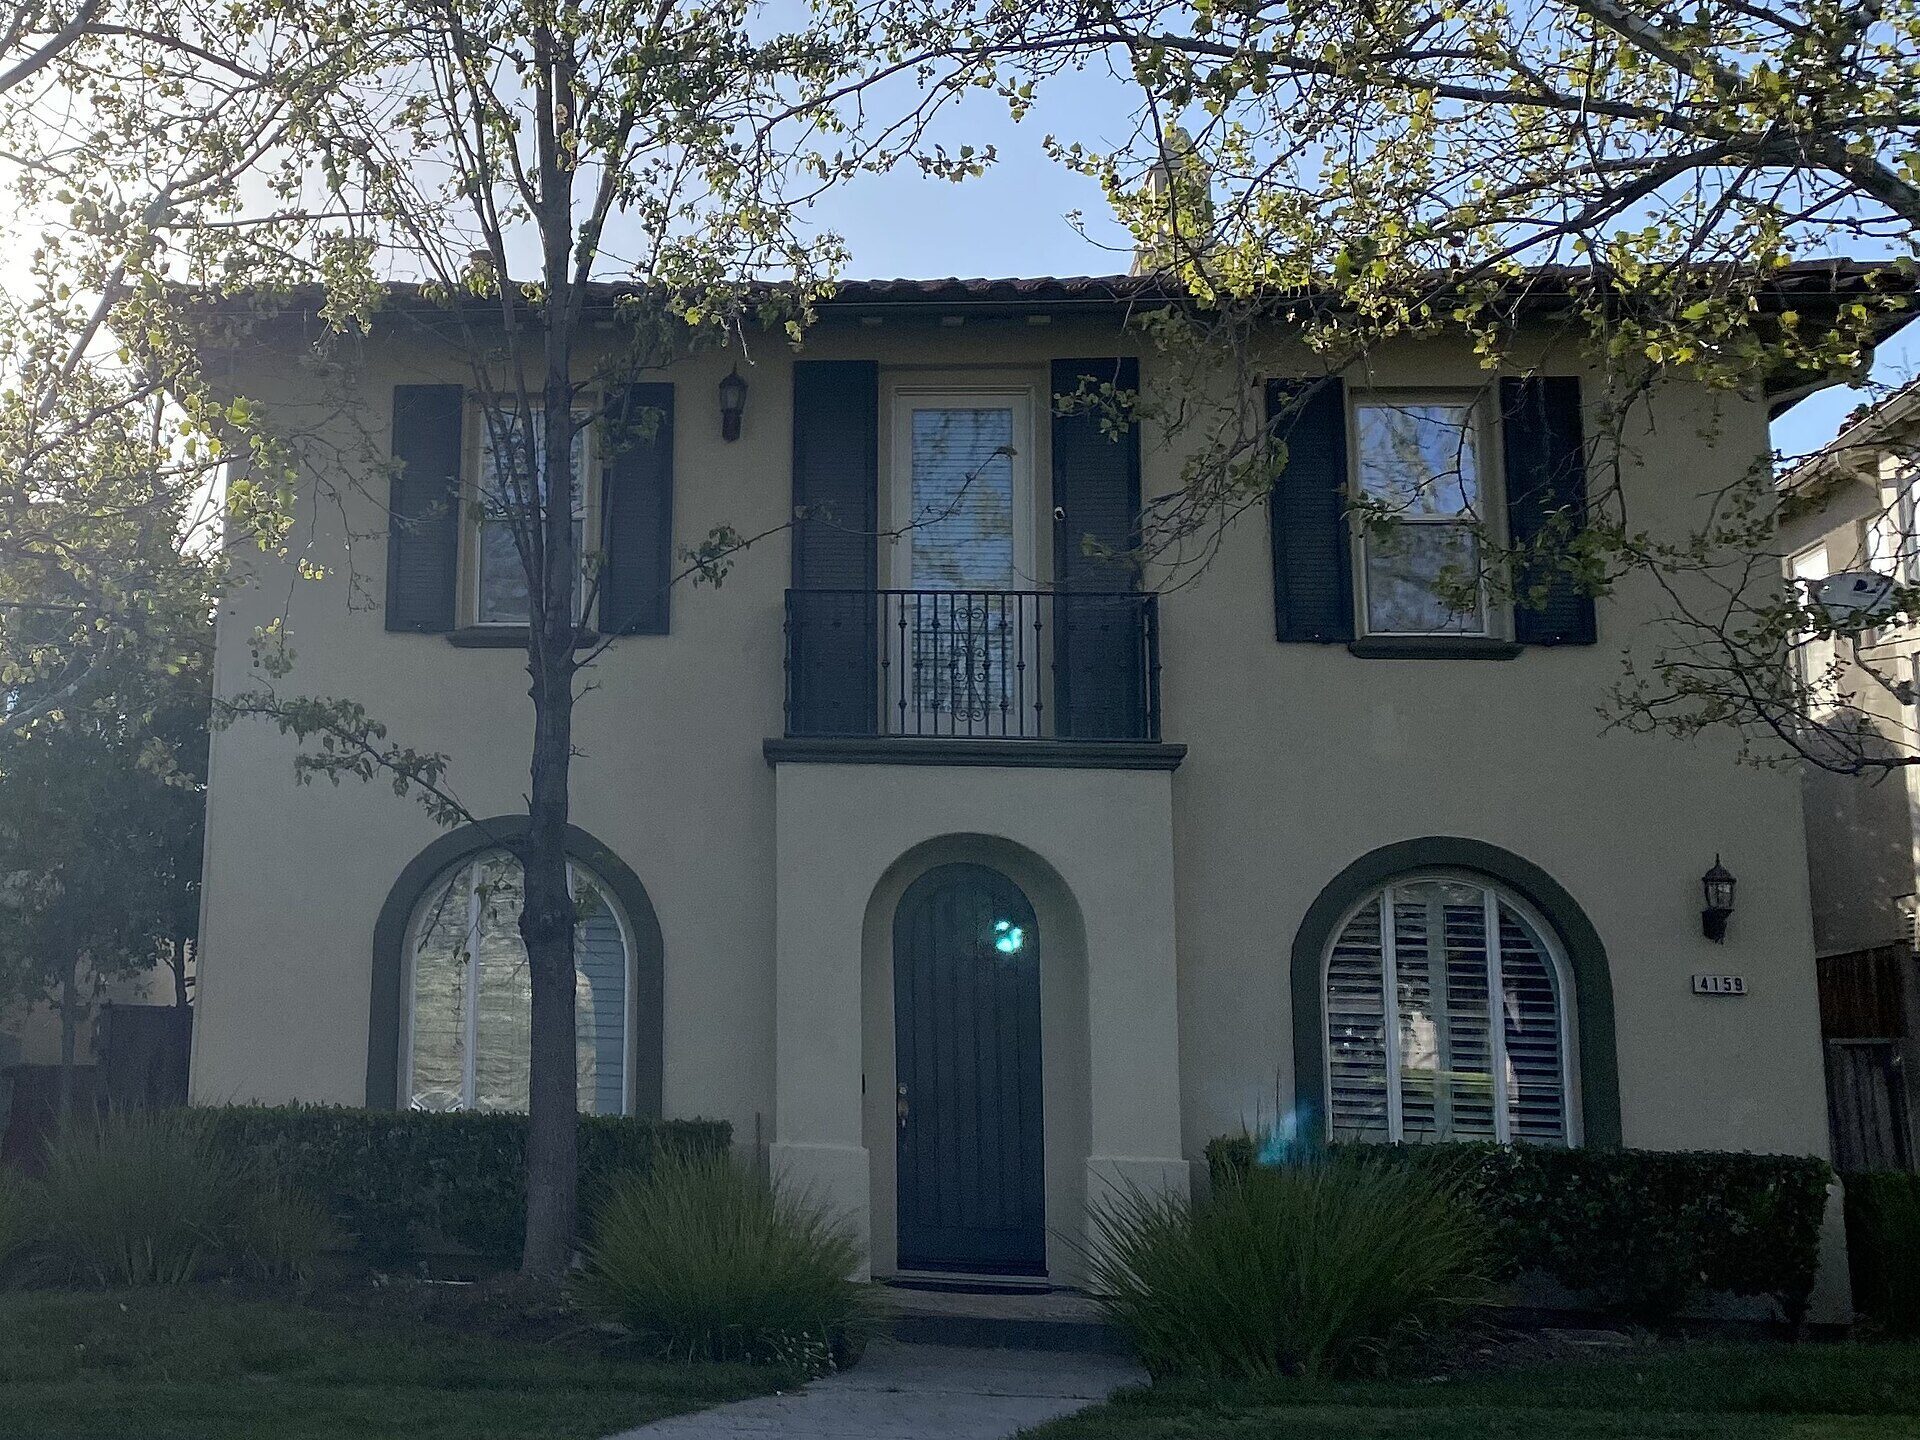
San Jose. As the largest city in the nation’s most expensive metro, San Jose offers the widest range of price points in the county. Established single family neighborhoods such as Willow Glen, Rose Garden and Almaden Valley sit well above the county’s entry level, while condos and townhomes downtown, in North San Jose and in Evergreen give first time buyers more options.
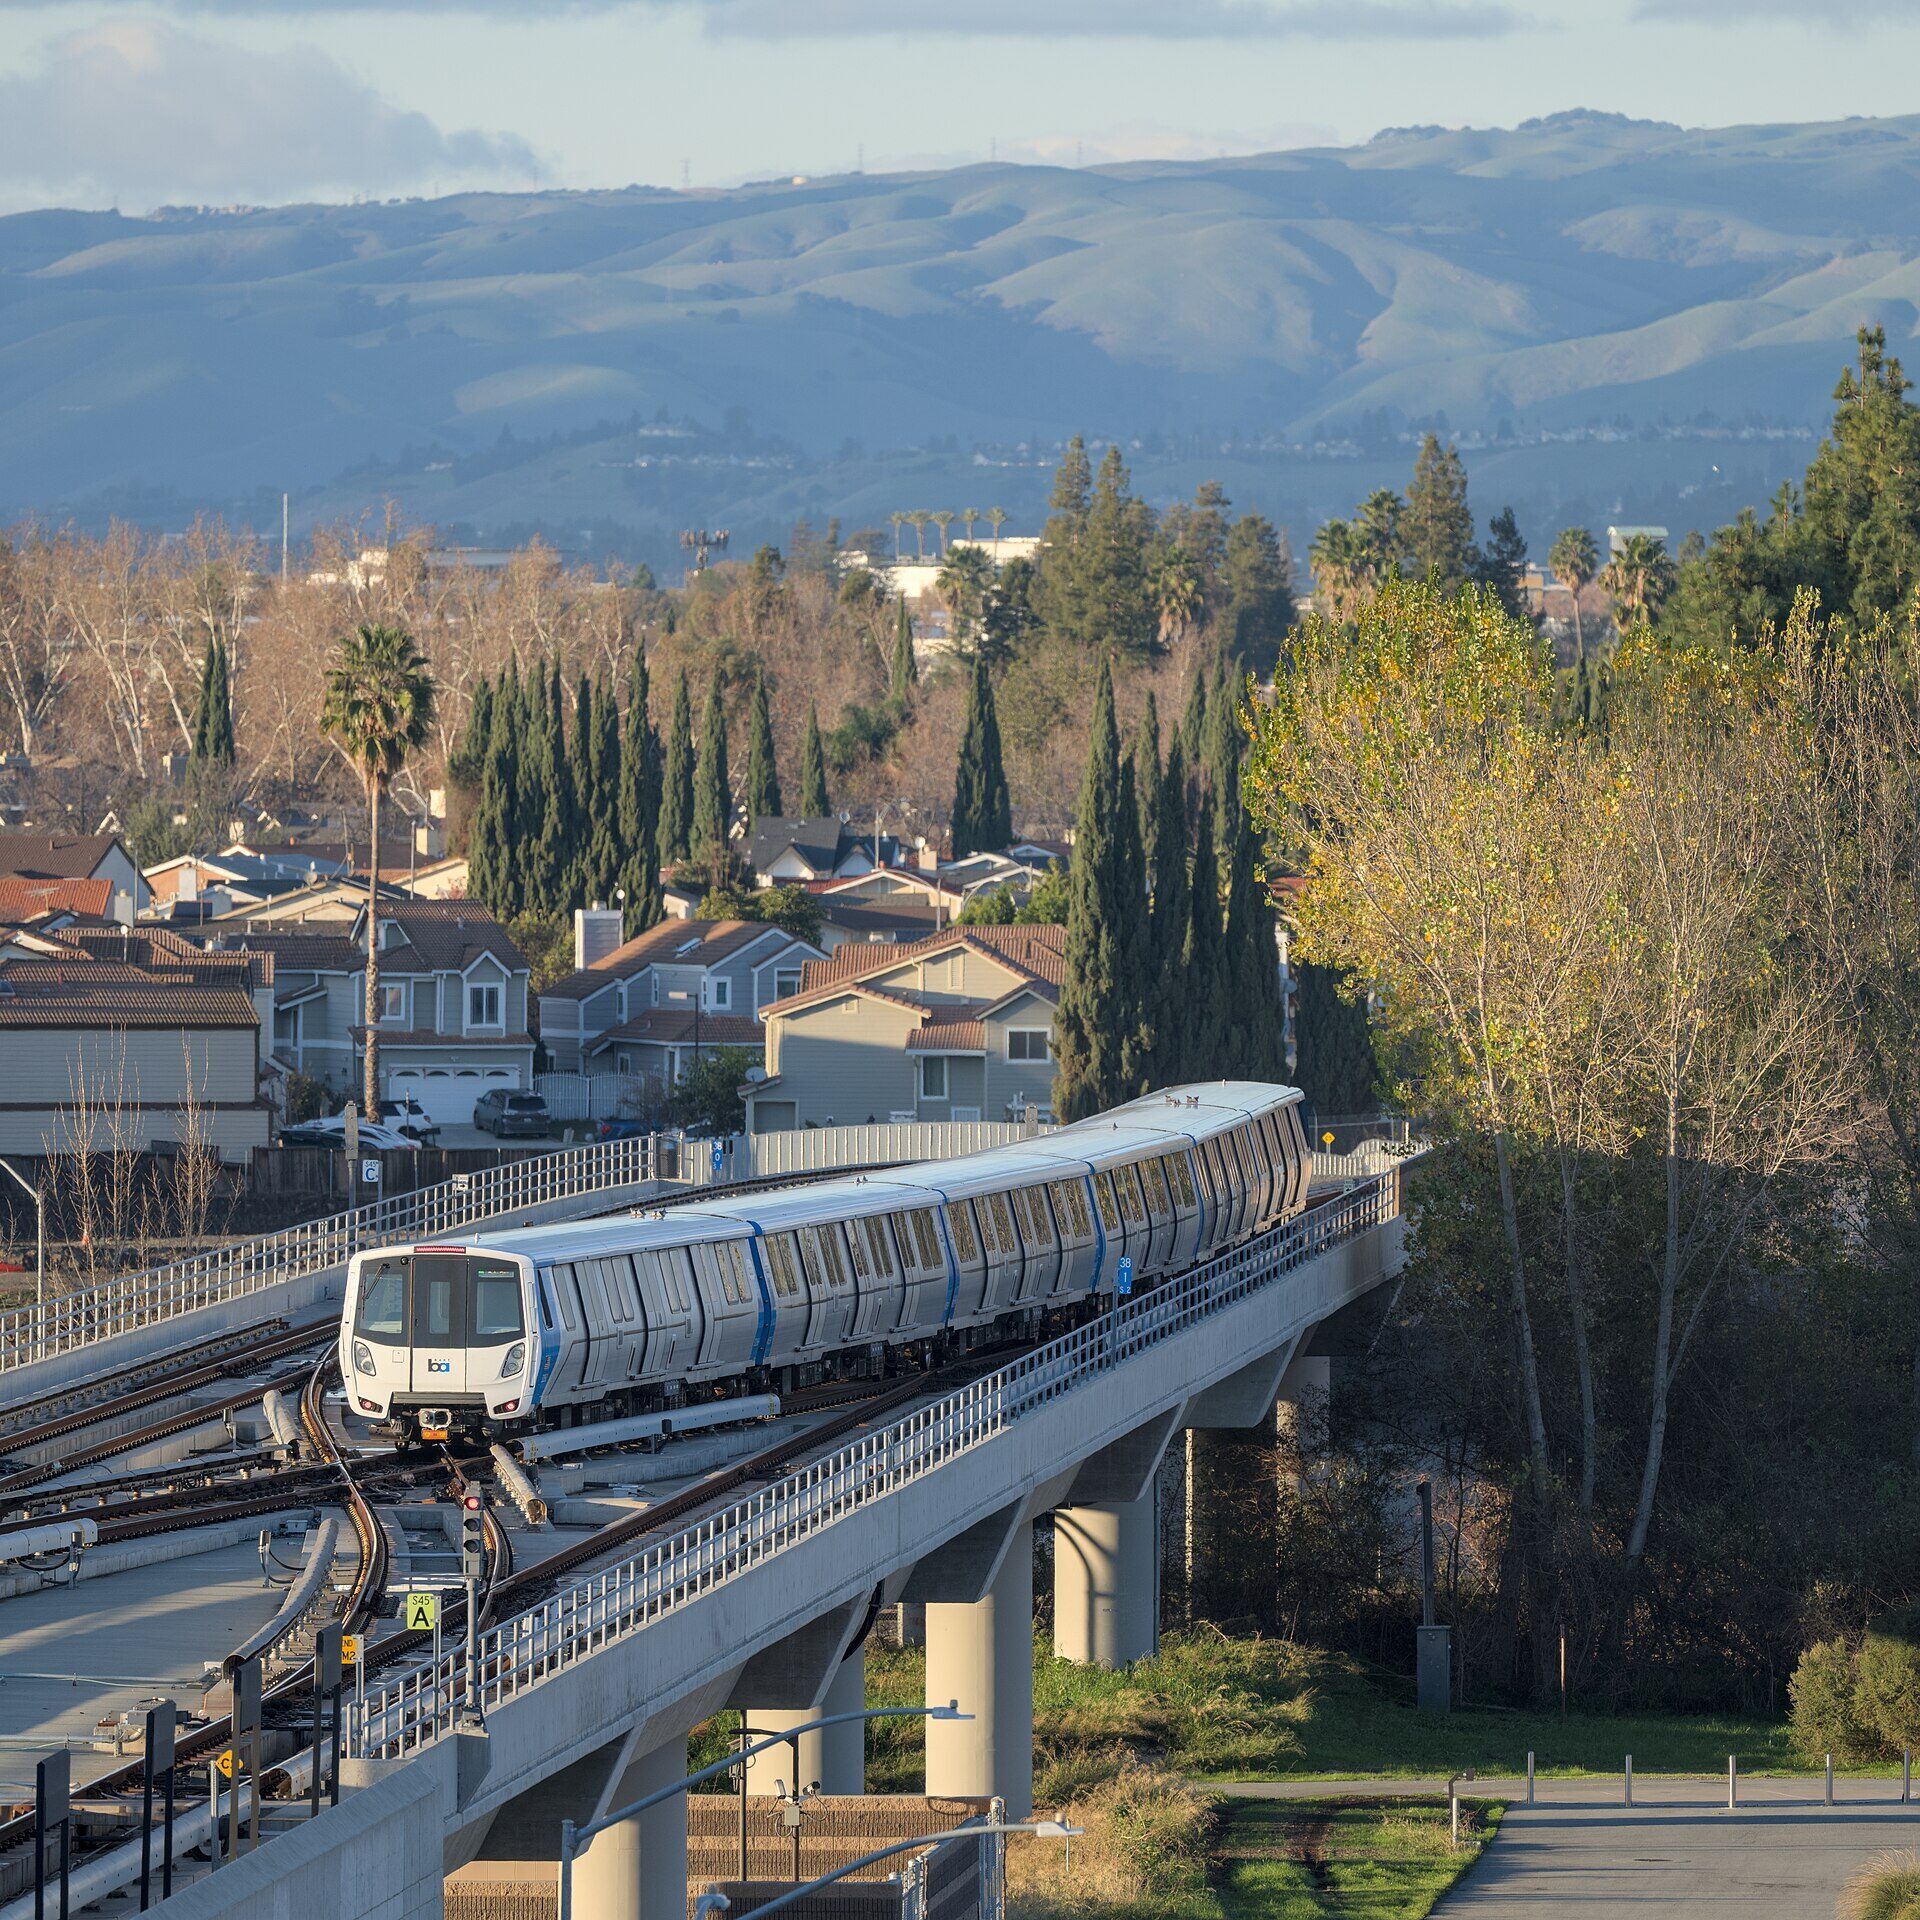
Evergreen and Berryessa. These East San Jose areas combine newer homes, townhome communities and, in Berryessa’s case, BART access. They tend to attract move up and first time buyers who are especially sensitive to rates, so weeks with lower rates often bring a quick pickup in showings here.
Cupertino, Saratoga, Los Gatos and Palo Alto. At the top of the market, many buyers draw on stock based wealth and existing equity, the AI driven dynamic Yun described. Supply stays tight, and homes near top rated schools still draw strong interest.
Frequently asked questions
How much income do you need to buy a home in Santa Clara County?
C.A.R.’s third quarter 2026 index puts the minimum qualifying income at $489,200 for the county’s $1,920,000 median priced single family home, with a monthly payment of $12,230 including taxes and insurance. Buyers of lower priced homes, condos and townhomes need less, and your own number depends on your down payment and debts.
Is affordability in Santa Clara County getting better or worse?
Slightly better. C.A.R. reported that 23% of Santa Clara County households could afford the median priced home in the third quarter of 2026, up from 22% in the second quarter. Mortgage rates also eased to 7.24% for the week ending October 29, the lowest level of October.
Is San Jose still the most expensive housing market in the U.S.?
Yes. NAR’s third quarter 2026 report put the San Jose Sunnyvale Santa Clara metro median at $1.92 million, up 0.3% from a year earlier, the highest of any U.S. metro area.
Should I wait for rates to fall before buying?
Nobody can time rates reliably, and waiting can mean more competition if many buyers return at once. Get preapproved, set a comfortable payment, and buy when the right home appears, knowing you may be able to refinance later.
Is now a good time to sell in San Jose?
It can be, especially for well prepared homes. Holiday listings face less competition, and San Jose remains at the top of the national price list. Because new listings are up and buyers are payment sensitive, accurate pricing and strong presentation matter more than ever.
The bottom line
Buying in Silicon Valley is expensive, and the new affordability data confirms it. But the trend has stopped getting worse: Santa Clara County affordability ticked up last quarter, rates eased for two straight weeks, and buyers have more listings to choose from than a year ago. For buyers, a clear budget and a fresh preapproval turn those headlines into a plan. For sellers, pricing to the payment and preparing the home well are what win in a market where every buyer is doing careful math.
Whether you are wondering what you can afford, where your money goes furthest in the South Bay, or how to price your home for this season, I would love to help you build a plan using the latest local numbers. Call or text Najwa Khoury at 408-477-6262 or visit NajwaRealEstate.com to set up a no pressure consultation.
Najwa Khoury, Real Brokerage, DRE #02026194
Sources
- California Association of Realtors, “California housing affordability holds steady in third-quarter 2026,” October 30, 2026 (via PR Newswire / Yahoo Finance)
- National Association of Realtors, “Home Prices Strengthen Across Most Metros in Q3,” October 29, 2026
- Freddie Mac Primary Mortgage Market Survey, October 29, 2026
- Redfin, “U.S. Home-Sale Prices Just Fell for the First Time in 3 Years,” October 29, 2026
- California Legislative Analyst’s Office, “California Housing Affordability Tracker (3rd Quarter 2026),” October 21, 2026